I have added a Definitions page which will include all of the terms and abbreviations that I use from now on and will be referred to on every post.
Substack has launched an iOS app for those of you using apple devices. I am an android peasant and can’t tell you if its good or not, but check it out if you have an iPhone or some other such trappings of royalty.
Please feel free to skip around or ignore certain sections if it does not apply to you. The Table of Contents is made to preserve your time in this manner. You can always simply read the conclusion if you are in a hurry.
Review this post for back ground information on what CPI is.
Table of Contents
Background
May CPI Report
Energy
Food
Airfare
Market Impacts
Conclusion
1. Background
A month ago when the April CPI came out there were many within the financial class claiming that we had hit “peak inflation,” and that the April CPI was proof that the rate of price increase would start slowing again. To come to this conclusion you would have to look at the headline number only while failing to read the CPI report last month. Following that conclusion, many were expecting for the May CPI report to be a continuation of this trend.
Unfortunately if you dive deeper into the April report it gets worse. Much of the pullback from the March print was because energy and gas prices in April fell in comparison to March. Energy was down 5.4% and gasoline down 6.1%. Now we are halfway through May and setting record gasoline prices, while a discussion of an impending diesel shortage is looming. If not for energy prices retracting, the April report would have exceeded the March report as most every other sector continued to rise. When the May report gets closer I will revisit this, but I wouldn’t be surprised to see it exceed the March report.
Moving forwards, I expect US CPI to hold flat in the ~8.X% range for the foreseeable future. This is because we are now starting to be compared to (year over year) months in 2021 when inflation had begun to break out of its range. This is while present prices are still rising sharply. We have already covered why and how the CPI metric is broken in the CPI background post, so I won’t bore you with the details. But if we compare a month in this year when prices are rising sharply to a month in the previous year when prices are rising sharply, we will have a hard time really increasing the rate on a monthly basis, but the continuing supply shocks and failure at the corporate level will stop the inflation rate from decreasing. Hence the new normal of persistently stubborn inflation.
It took Janet Yellen several years to finally figure it out, but she has come around with her most recent quote of “I do expect inflation to remain high.” The Fed and the US Treasury have finally figured it out, inflation is here to stay. She can blame Russia, Ukraine, or greedy corporations, but the truth is that the blame lies on the US legislature for writing bills that spend money we don’t have, The US Executive branch for signing bills to spend money we don’t have, and the Federal Reserve for printing the money to keep interest rates low in order to facilitate the spending of money we don’t have. These 3 parties are all equally responsible for inflation, they just will never admit it. We have never had a fiscally responsible president since Carter, nor have we ever had a fiscally responsible legislature. The only fiscally responsible Federal Reserve Chair was Volcker (appointed by President Carter), there is no political party that can claim to be fiscally responsible, and thus they all deserve blame.
2. May CPI Report
On a year over year basis, CPI in May rose 8.6% which is a new 40 year high, but as discussed, CPI was reformulated 40 years ago to exclude actual rents and home prices, so in reality this is more likely an 80 or 90 year high in CPI.
The first thing that stands out at me is the monthly increase in May alone.
The Consumer Price Index for All Urban Consumers (CPI-U) increased 1.0 percent in May on a
seasonally adjusted basis after rising 0.3 percent in April
That’s right, 1% inflation in the month of May alone, and that’s using the governments broken scale. If that were to continue for the next 12 months, that is of course a 12% year over year inflation rate. The only thing that saved this report from being higher is the phenomenon I previously discussed, and that is that we are comparing it to May of last year when the CPI finally started to break out, and this comparison to a baseline that is rising quickly blunted the year over year number slightly.
Energy
After declining in April, the energy index rose 3.9 percent over the month with the
gasoline index rising 4.1 percent and the other major component indexes also increasing.
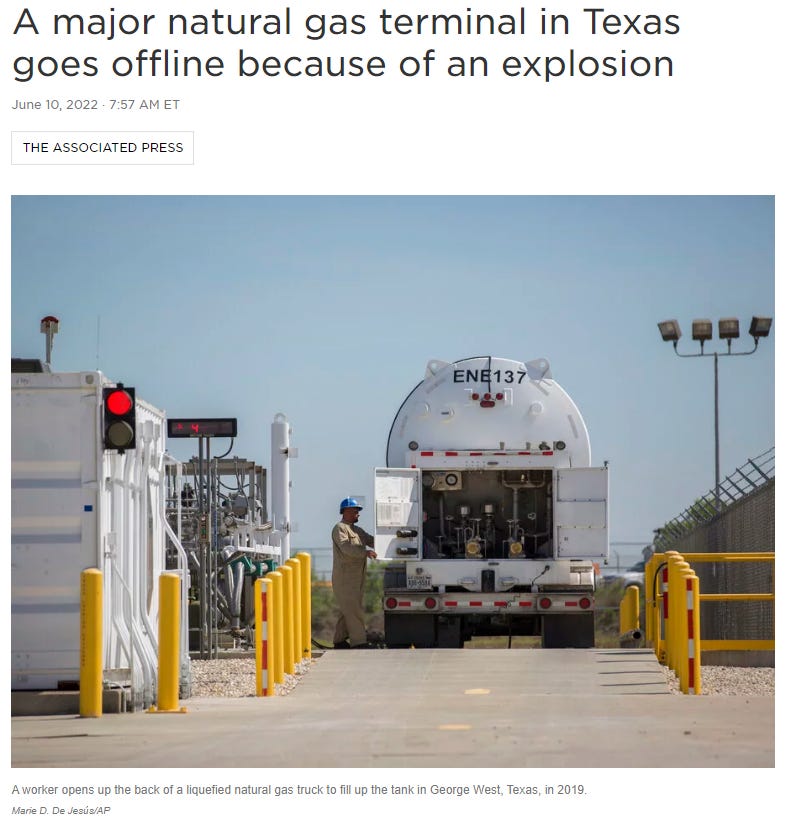
As I predicted last month, the energy index was the largest growth sector as Fuel prices continued to surge after the brief lull in prices back in April. I would expect this trend to continue for June as well, but of note, US ability to export Natural Gas was hampered today after an explosion at an LNG facility that was responsible for 20% of our export capacity.
These LNG export facilities were primarily serving Europe, China, and Japan’s needs for LNG, this will further raise the prices for energy in Europe at the worst possible time for them, while Asia will lean more heavily on Australia and the Middle East for LNG exports which will also raise prices briefly in Asia. This will on the other hand briefly slow the rate of increase of natural gas in the US, as domestic markets will be flooded with gas that was otherwise going to be exported. This might allow energy prices in June to remain flat as it will take 3-4 weeks to repair this LNG export facility. If that is the case, then we might see a low 8.X% CPI print for the month of June.
And we achieved a little bit of history today.
The energy index rose 34.6 percent over the past 12 months. The gasoline index increased 48.7
percent over the span. The index for fuel oil more than doubled, rising 106.7 percent; this
represents the largest increase in the history of the series, which dates to 1935.
One of the few statistics the government can’t adjust within this report is the changes in the price of fuel oil (gasoline for cars, kerosene for jets). On a year over year basis this has more than doubled, which is the largest increase ever recorded since the CPI started in 1935.
Food
The index for dairy and
related products rose 2.9 percent, its largest monthly increase since July 2007
...
the index for eggs rising 5.0 percent
These are significant monthly increases for food inputs. It’s likely that the bird flu that is decimating Chicken populations and the increase in the cost of feeding cattle have been pushing the prices of dairy and eggs up significantly. Unfortunately there is no real relief in sight for these sectors and I would expect food prices to continue to push higher into the summer and fall, while simultaneously the impacts of the fertilizer shortage will begin to manifest alongside the fall harvest.
The food at home index rose 11.9 percent over the last 12 months, the largest 12-month increase
since the period ending April 1979. All six major grocery store food group indexes increased over
the span, with five of the six rising more than 10 percent. The index for meats, poultry, fish,
and eggs increased the most, rising 14.2 percent, with the index for eggs increasing 32.2 percent.
The remaining groups saw increases ranging from 8.2 percent (fruits and vegetables) to 12.6
percent (other food at home).
Of note, the year over year increases for food do not look much better.
Airfare
The index for airline fares continued to rise, increasing 12.6 percent in May after rising 18.6
percent the prior month.
Airfares continue to rise on a monthly basis over 10% each month. This is likely a reflection of the significant jumps in fuel costs, and also probably due to staffing shortages and having to pay new employees significantly more in order to fill vacancies.
Overall this was a bleak report with no real bright spots or points of hope for the consumer. I wish it weren’t the case.
3. Market Impacts
We could talk about immediate market impacts, and I will briefly, but they aren’t what’s important. The market knee-jerked into selling assets with most prices down, and a few assets up.
So we can’t just try to trade this in terms of Bad report = market down, or some other elementary heuristic, we must instead remember that the only type of trading that goes on is front-running the Federal Reserve, everything else is a mistake. With that in mind, first… what is the truth? The truth is that higher inflation will pressure a number of different levers that the Fed is interested in.
High inflation pressures treasury yields higher by decreasing demand on treasuries with a negative real yield (If the treasury yield is below the rate of inflation, retail is less likely to consider them).
High inflation pressures the ruling administration who then pressures the Federal Reserve which is not an independent division despite their claims to be
The market presumes high inflation will be combatted by the Fed with higher rates
So from this we can deduce that the treasury markets will be under even more pressure than they already are, as discussed last month, the Fed has stated they intend to start selling treasuries into the Secondary market in 5 days. So interest rates across the board will be pressured upwards. The ruling administration may be pressuring for a rate hike as well in the hopes it will alleviate inflation (it won’t unless they start pushing interest rates up 2% or more at every single meeting and target an overnight lending rate above 20%, which they are mathematically incapable of doing). The markets presumption is that inflation will be combatted with rate hikes.
So short term what is the conclusion? The fed will continue to provide token rate hikes that are heavily outpaced by the interest rate increases of the treasury markets. As discussed previously, due to the current existing debt and the deficit the federal government is attempting to run, they mathematically cannot afford for net interest payments to eclipse 4%.
Since the Fed is no longer watching the markets, we have to presume that the only force that could turn their trajectory around is the treasury itself. What does the Treasuries ability to pay back debt look like? Well, we’re at $30.4 trillion in total bonded debt. Lets do some basic calculations on what the interest payment looks like based on the total net interest rate.
When net interest >4%, the budget deficit exceeds total Federal Tax Income
I’ll repeat the caption. When net interest rate exceeds 4%, the budget deficit exceeds the total Federal Tax Income. As we see treasury yields across the board increase, we will see the treasury having to issue bonds and notes at a higher net interest. Looking at the treasury yield curve as it is today, right now, we’re already at around 2% net interest paid.
The Fed can’t afford to raise interest rates high enough to outpace inflation, and worse as they sell treasuries into the secondary market they will be putting increased pressure on to the US Treasury’s ability to pay the debt.
The markets are selling off with the presumption that the Federal Reserve can successfully fight inflation while not threatening the Treasuries ability to pay it’s bills. Unfortunately, only one of those things is mathematically true, and I expect the government to choose it’s ability to pay it’s bills (with printed money) instead of choosing to continue to fight inflation while ruining the USA’s credit rating and defaulting. This means that the correct move isn’t to be selling, it’s to either be hodling or accumulating more for the inevitable capitulation of the Fed. But we also have to be mindful that we aren’t at the bottom just yet and not to blow our load going balls deep into a market that still has blood to bleed.
4. Conclusion
I normally don’t add additional information in the conclusion but there is one sad conclusion that comes out of all of this. The middle class and those living paycheck to paycheck will be squeezed out of existence as they are likely forced into selling the very assets they need to be holding on to in order to cover their living expenses.
The dark mathematics of inflation going up by 10% in a year is this. If an individual is spending 80% of their paycheck on food, energy, and housing, and that index goes up 10%, they are now spending 88% of their paycheck on those items. If this same individual was only saving 5% of their paycheck, they are now in the hole 3% every month. The sad truth of America is that a majority of people live at or near paycheck-to-paycheck.
Dickler? I hardly know her.
This is true across the income brackets as lifestyle inflation pushes even 1/3rd of Americans making over $250,000 a year to be living paycheck to paycheck. Are these people who are living paycheck to paycheck going to be cutting their expenses? The truth is that no they won’t, they probably can’t. So what will they be doing with any investments they might have? They will be selling them in order to pay their living expenses. And who will be buying? The top 1%, institutions, and people with sustainable finances.
Wealth will transfer. For the time being asset prices will keep grinding down and sideways. The markets will continue to believe that the Fed can fight inflation, and those who will need to hold on to their assets the most will be the exact people selling off their assets to cover their expenses. If this is you, please read the FAQ for my basic financial advice. There is still time. But as I have stated many times, the ladder is being pulled up fast, and soon the upper class will solidify as class mobility within the US dries up or disappears entirely.
As time passes the bulk of investors in most all assets will be institutional investors, while retail and individuals will make up a smaller and smaller share as the majority of people are underwater and forced to sell assets to pay bills. In an inflationary environment, the thing with the least amount of value is money, but as is always the truth, the general public is typically doing the worst possible thing they can in any given moment. So as inflation continues to pick up, most people will be moving into cash at their own expense. Plan accordingly.
It's worth mentioning that DCA'ing on the way down is only applicable to those with sturdy income and an emergency cushion of fiat. I am personally above water thanks to my secure job and a small emergency stash of fiat. However if multiple inevitable headaches accumulate and occur at once in my life (e.g., car problems, medical emergencies, etc.) I would be pretty screwed. I have halted DCA, hodling my crypto, and am focusing on adding to that fiat stash.
As you say, the ladder is being pulled fast. I want to be secure knowing I can still grab it.


To quote Tom Luongo, "They are vandals doing this on purpose, they are not incompetent"
It's worth mentioning that DCA'ing on the way down is only applicable to those with sturdy income and an emergency cushion of fiat. I am personally above water thanks to my secure job and a small emergency stash of fiat. However if multiple inevitable headaches accumulate and occur at once in my life (e.g., car problems, medical emergencies, etc.) I would be pretty screwed. I have halted DCA, hodling my crypto, and am focusing on adding to that fiat stash.
As you say, the ladder is being pulled fast. I want to be secure knowing I can still grab it.
Thanks again for the great work.