

Review 4/26/22 - The Stagflation Giveaway
Review 4/26/22 - The Stagflation Giveaway
US GDP Goes Negative - $EVMOS launch

Welcome we will be reviewing macro events from this past week from The Post I made at the beginning of this week on 4/26/22.
I have added a Definitions page which will include all of the terms and abbreviations that I use from now on and will be referred to on every post.
Substack has launched an iOS app for those of you using apple devices. I am an android peasant and can’t tell you if its good or not, but check it out if you have an iPhone or some other such trappings of royalty.
Please feel free to skip around or ignore certain sections if it does not apply to you. The Table of Contents is made to preserve your time in this manner. You can always simply read the conclusion if you are in a hurry.
The $EVMOS launch is a decent event to be aware of and I discuss it in section 6 under the Cosmos ($ATOM) section.
We have reached another milestone in subscribers and as such I will be giving away a 1 year subscription. This is open to both free and paid subscribers, the only ones who cannot win are those currently enjoying a free year already.
For the competition, please tell me in the comments what you would do if you were in Elon Musk’s financial position. What company would you buy, what changes would you make? What sorts of lasting project of the human species would you fund? I will be arbitrarily picking a winner depending on my mood next friday. No idea if a serious, humorous, intelligent, optimistic, or vindictive suggestion will win. Just have fun with it.
Table of Contents
Twitter’s Freeroll
US GDP goes Negative
Central Bank Speeches
European Central Bank
Swiss National Bank
Bank of Canada
Bank of Japan Interest Rates
Dollar Index, a False Bull
Crypto Macro
Cosmos ($ATOM)
Conclusion
1. Twitter’s Freeroll
On Monday, Elon Musk had his offer to buy Twitter accepted by Twitter’s Board of Director. I saw a bit of negativity towards the news on Instagram, which seemed unwarranted to me. Not possible to make Twitter any worse than it already is, so there was in effect nothing to worry about. It could only go up from where it was, and it seems as if it is already starting to improve as many accounts that were banned unfairly have started to come back "inexplicably,” while quite a lot of mainstream accounts have seen their follower counts fall drastically as its likely that bot farms and fake follows began to be cleared out. Twitter also admitted during their earnings report that they had overestimated their daily users by ~1.4-2.0 million users for the past 3 years. Funny how mistakes like this are only admitted in hindsight when no more negative consequences could accrue to them.
Some people are claiming that their accounts are being unbanned with no explanation.


We have seen several accounts return after being gone for several years, and I am still hoping that I will see a similar fortune. Ultimately, the worst thing Elon could do is equivalent to what Twitter already was for most of us, this is a complete free roll for us, and I see nothing but potential upside. I’ve spent the last few years just accepting that I have no access to Twitter, if things go back to that again, I’ll be fine, and I suspect that most of you would be fine with that as well.
If you haven’t already seen it, Tim Pool proposed a theory for what Twitter staff are doing behind the scenes that resulted in large changes to follower counts, I won’t repeat it here, the video is here if you wish to see more.
2. US GDP Goes Negative
I covered this briefly on my Instagram on Thursday, but I will go into further detail here today.
First, I honestly did not see this coming, otherwise it would have been included in my forecast post from the start of the week. If you had asked me to guess the number at the start of the week, I would have guessed between 0.5—0.9% growth. A prediction like that isn’t even worth writing about because it doesn’t move the market. The official report from the BLS is here.
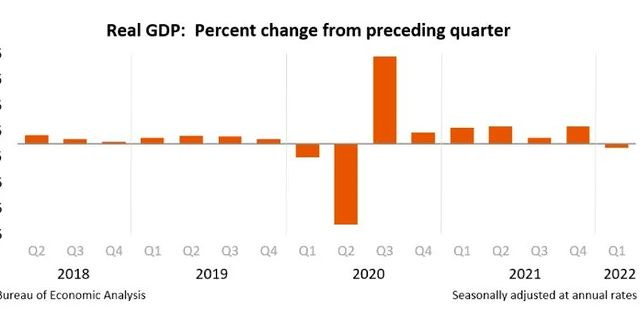
So, how does the BLS calculate Real GDP? The short explanation is that GDP is equal to the sum of personal consumption expenditures, gross private domestic investment, net exports of goods and services, and government consumption expenditures and gross investment.
Real GDP adjusts the above calculation against inflation.
Of note, imports grew 17% from the previous quarter, while exports fell another 6%. The value of imports is subtracted, and because we are a heavy net importer, this weighs heavily against our GDP. As we shift further towards being increasingly reliant on imports for the economy to function it is more likely that GDP prints will be negative. In general, when an economy is more dependent on debt-financing imports, this is a sign that the economy is not productive and thus is not sustainable.
Another note, in Q4 of 2021 a lot of businesses and industries were building inventories and placing orders in anticipation of inflation continuing. Typically when we see businesses trying to stockpile like this, it usually indicates that there will be a dearth of purchases in the following quarter. Last quarter’s GDP growth was 6.9%, it could very well be that a portion of this quarter’s expenditures and deliveries occurred in November and December of last quarter and so we simply did not see them this quarter. That is a possibility and potential null hypothesis countering the prevailing narrative I am presenting. However, I did some further digging and found that business inventories kept rising in January, and February, and likely in March (March data comes out on May 17th) as well. So this is a potential null hypothesis, but seeing as we have inventories data for January and February that supports my base assumption, I think it is more likely that the deflator (explained in next paragraph), and our trade deficit are the main factors in play for our negative GDP growth for the quarter. We will be watching GDP in line with CPI moving forward to see if this quarter’s number is further revised next month, as well as to see how Q2 performed once we are in July and August.
A final note, the report on GDP assumed an implicit deflator of 8%. The deflator, is a measure that roughly represents average annual inflation over the period of measure. They are presuming 8% inflation and that number is used to decrease the GDP figure further which is how we get to Real GDP. If inflation is higher than 8%, then GDP would be even further negative. When taken into the larger picture and remembering that the formulation for CPI was changed to decrease the inflation print in 1981, we have to consider what this means for US GDP stats over the past 4 decades. Yes, that’s right, they are over-inflated, and I would argue that since the year 2000, real GDP (if using a real measure for inflation) would be mostly negative for almost every single quarter since then. 9/11 was the high water mark for the financial recovery of the 80’s.
But, lets forget that, and go back to accepting the government at their word on inflation. What we are seeing now is stagflation. I have outlined this already before, but we are now in a period of time where cost of living will be increasing, while assets and investment values will be flat or down. Productivity of this country will also be flat or down, and businesses will continue to struggle for labor and production. This is the kind of time period where most people struggle and get thrown out of their investments. Living expenses are rising and those that over-extended themselves, didn’t set up an emergency fund, or don’t have a healthy income stream over expenses will be forced out of the exact investments they need to be holding when the Treasury reaches it’s crisis point. Many in the middle class will sell assets like property, crypto, businesses and precious metals, as a response to their rising costs of living. The last thing anyone might want in the mid-term are dollars, and yet it’s exactly what people are going to sell into in order to cover living expenses. Make sure this isn’t you. Do not over-extend yourself. The bottoms to these markets are not in yet, no matter how much crypto twitter tries to constantly call the bottom.
3. Central Bank Speeches
European Central Bank
As expected, the ECB is tripling down on holding interest rates down. Europe is very similar to Japan in that it is fairly clear how the Euro will end up. The ECB’s main goal is appeasing spendthrift governments to print money in exchange for being a part of the EU, which Germany neurotically believes will protect them from another European war. The ECB has to print otherwise countries like Spain, Portugal, Greece, and Italy would consider leaving if they were forced to run a balanced budget. This is paid for by other countries like Germany running a budget surplus and taking the inflation from these other countries on the chin. This was covered in depth in section 4 of this post.
This will continue as the Germans will never enforce standards or ask for any form of fairness out of fear of being called Nazi’s. The Euro’s fate is sealed, similar to the Japanese Yen.
Swiss National Bank
They were the wildcard this week, but the Swiss decided to remain reserved as ever. No mention of a potential break of policy away from the ECB, however we also did not get any mentions of wanting to push the value of the CHF down to keep it below parity with the Euro. It’s certainly possible that the SNB may allow the CHF to appreciate further, especially as they exhibit mild concerns about inflation. You will also not something interesting in the news article I linked.
At present, the Swiss National Bank (SNB) distributes up to CHF6 billionExternal link ($6.5 billion) between cantons and the federal government during profitable years. The SNB made a 2021 profit of CHF26.3 billion ($27 billion).
Yes, the Swiss National Bank makes a profit and distributes that profit to local governments and the federal government. Sounds like an alien planet right? Essentially to maintain the Franc below parity with the Euro, they have had to issue excess Francs at time when they have no need to because their government runs a balanced budget. When they issues these excess Francs, since they aren’t needed to finance deficits, the Swiss National Bank just prints it and invests it. You can read their investment guidelines here. Essentially they invest in foreign treasuries, gold, and equities (stocks). If their investments appreciate above their issuance of CHF, they sell a portion and distribute the profits to local governments and the federal government.
The Federal Reserve also turns a profit, and typically just gives this profit to the US treasury. They won’t make a profit this year, they will in fact be upside down, just like everyone else who purchased treasuries in January and is still holding them. Especially since the Federal Reserve is going to start selling assets into the secondary treasury market this May and realizing losses on them before they reach maturity. They are going to take an absolute bath in the US treasury market and mortgage backed securities markets. They have nobody to sell them to. There is no one out there with a bigger printer to bail them out. The Fed is the buyer of last reserve. In 2021, the Federal Reserve earned $107.4 billion in earnings that they transferred to the US Treasury.
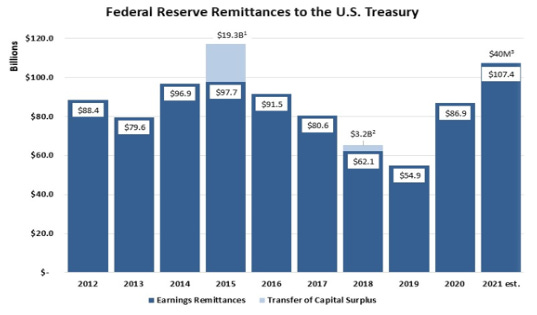
The rules for how the Fed handles earnings are covered in Section 7 of the Federal Reserve Act of 1913. There are no statements for what they do if they are upside down. You’ll note that in the chart above, the Fed makes the most money in years when interest rates are artificially held down by money printing, and their earnings decrease the most in years where interest rates are rising and they are forced to sell treasuries on the secondary market prior to maturity. Interest rates on treasuries in the secondary market moved peacefully in 2018 and 2019 compared to what we have already seen in just the past 4 months of this year, and thats before the Fed has started unloading. This year, the losses central banks see (especially ours) will be biblical, unless they reverse positions and print, at which point they will just bee pushing those losses to some point further in the future.
Bank of Canada
Statements from the BoC were in line with what we expect. Inflation is too high, they are committed to raising interest rates to fight inflation and they believe they can do so. Current overnight rate is 1%, and their statement put a neutral overnight rate at 2-3%. It’s fairly safe to assume that they will keep raising interest rates until they are within the neutral range and they will continue to let their balance sheet decrease by not repurchasing treasuries when they reach maturity.
Their plan is sustainable within the current financial status of the Canadian federal government. I would expect CAD to appreciate as a carry trade is created as they continue to raise rates.
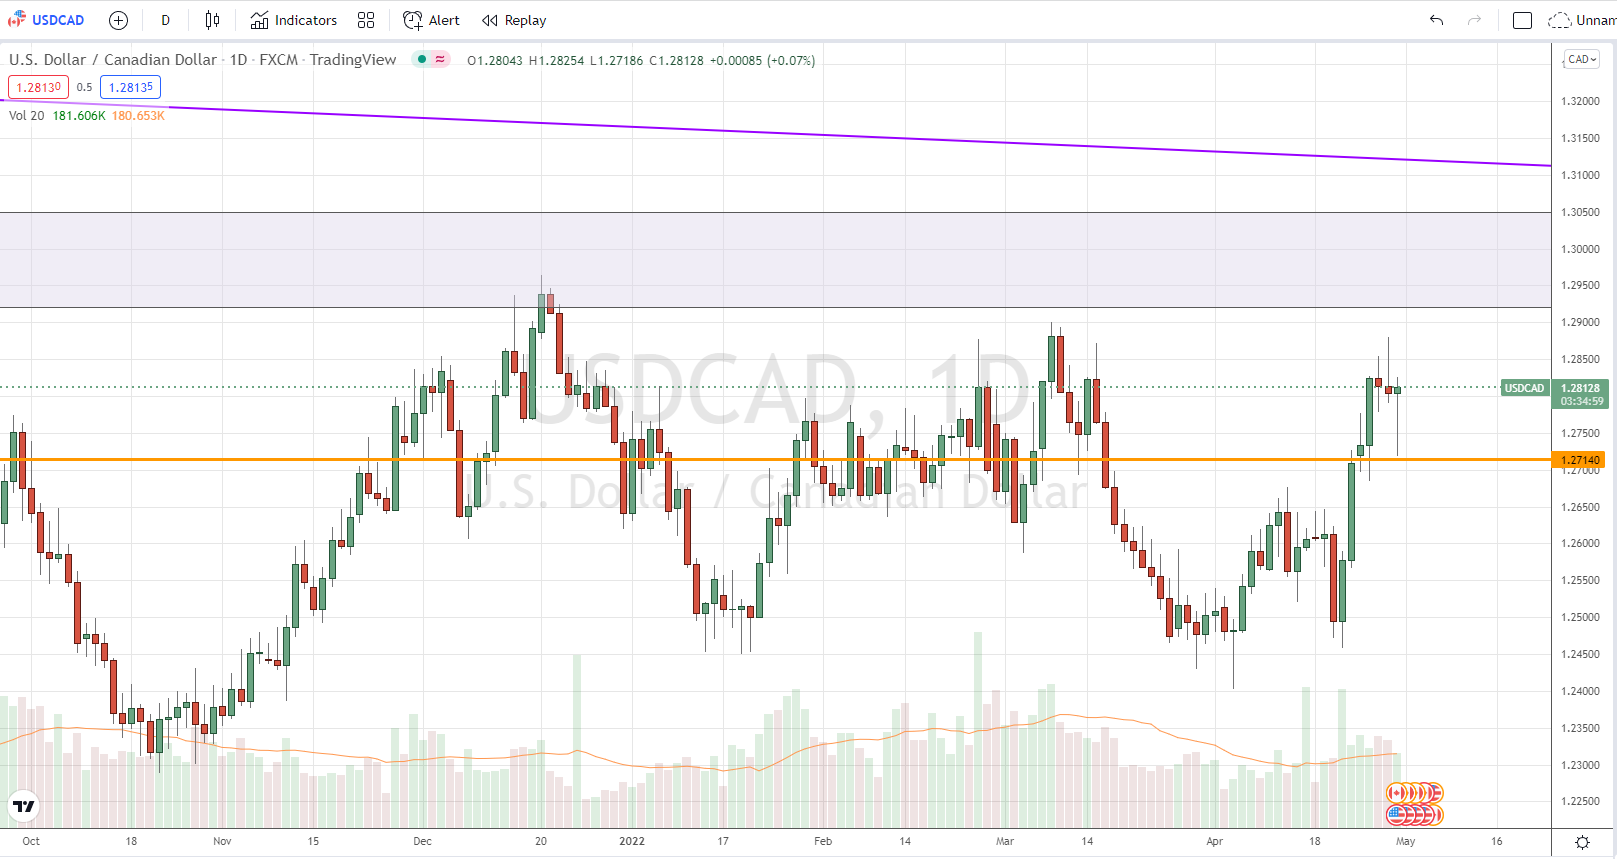
The same targets for USDCAD that I presented back in December (Section 4 of this post) are still in play for a short entry. I would expect USD to spike up significantly right when the Federal Reserve is forced to step into the markets. USDCAD could reach as high as 1.31 for a long term short hold carry trade.
4. Bank of Japan Interest Rates
My outlook on the bank of Japan has not changed from Section 3 of this post. I will no longer be covering Japanese central bank moves unless they make significant changes. They have (of course) made no move to cut interest rates and have instead dove head-first into exactly what I said they were going to do. The Bank of Japan president stated that the Central Bank is willing to intervene into the Japanese bond market “every day, if necessary” to keep interest rates low. Yes, thats right. They are committed to printing money to fund their government forever. Until Kuroda steps down in 2023, the Yen, as a currency will crater. Currently the yen is the 3rd most used currency in commerce and as global fx reserves. Investors have already started leaving the Japanese Yen, and the echoes of this move will likely lead further towards the Chinese Yuan taking a larger foothold globally.
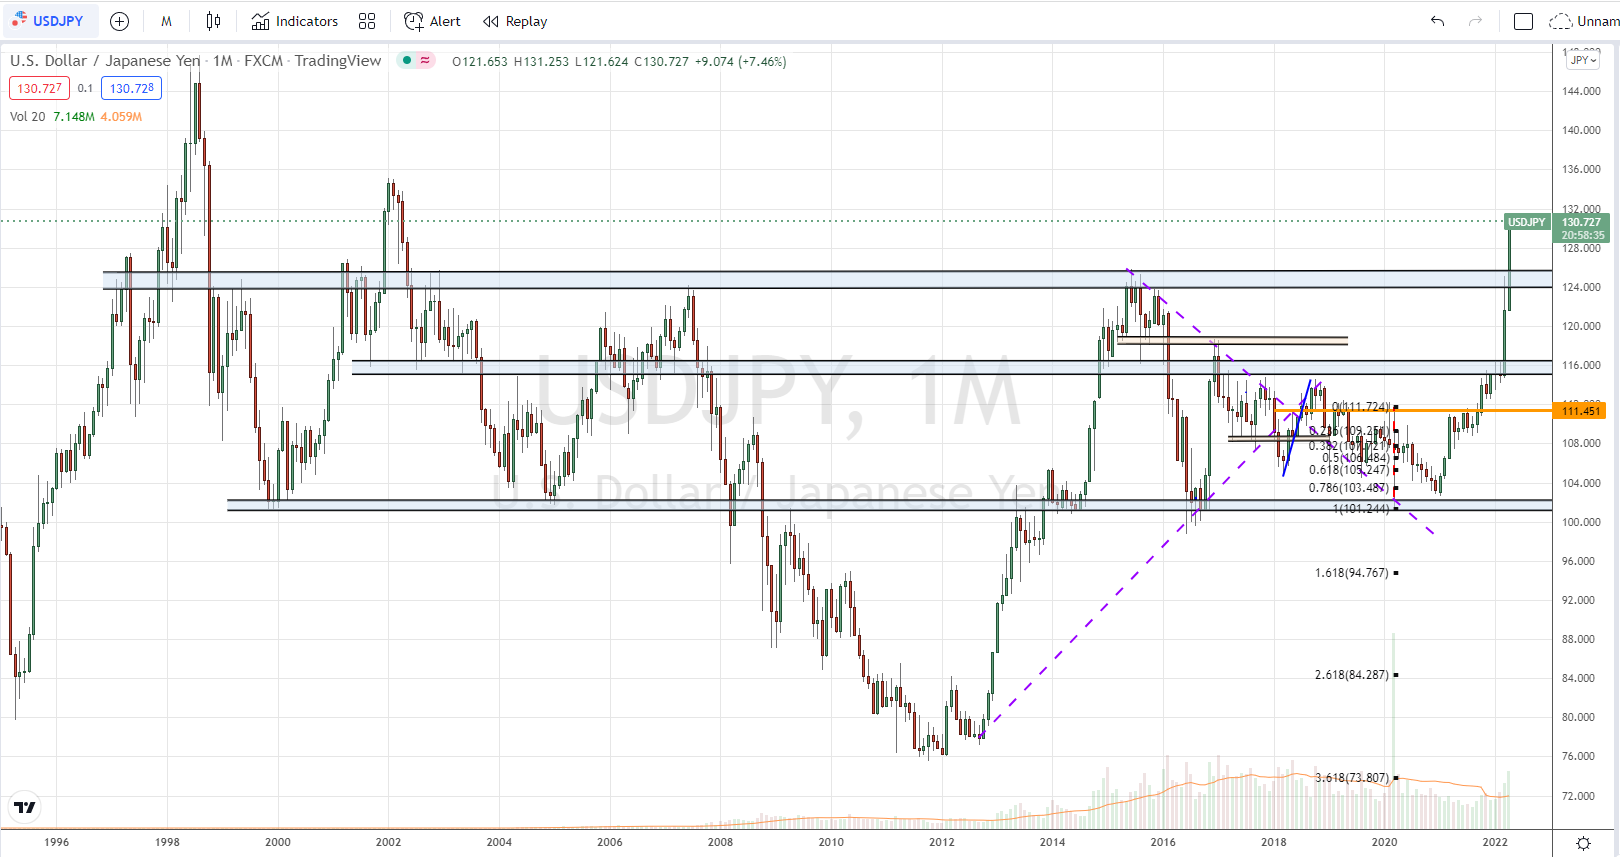
The Yen has lost 30% of its value against the US dollar over the last year. Against other assets, it’s doing even worse. The yen lost this much value, yet Japanese government statistics have inflation in Japan at just 1.2%. Yeah, I don’t believe that either. For a country that is dependent on imports for food, energy, and raw materials, there is no way your currency can fall this much and experience basically no inflation. That’s a lie. Similar to our government lying to us about CPI.
If you have a forex brokerage and want to take a position against JPY, you have probably missed any good entries and would need to wait for a retest of 158.17 on GBPJPY for a long entry into the carry trade. Shorting the JPY for the rest of Kuroda’s term will probably be one of the easier trades to make for the year, as they will be printing money essentially forever as they don’t really have any good way to end Kuroda’s term early, and I’m not sure if Abe or any members of Japan’s political class really see anything wrong with this sort of financial vampirism. Sadly, this is the fate awaiting the Euro, and the US Dollar as well.
All future posts about Japan, and the Bank of Japan will reference this section and other previous sections, as there will be nothing new to talk about except pain for the Japanese people. That would be repetitive for you, and ultimately not actionable financial advice.
5. Dollar Index, a False Bull
Some of you may refer to the DXY when you wish to get a picture of how the dollar is performing.
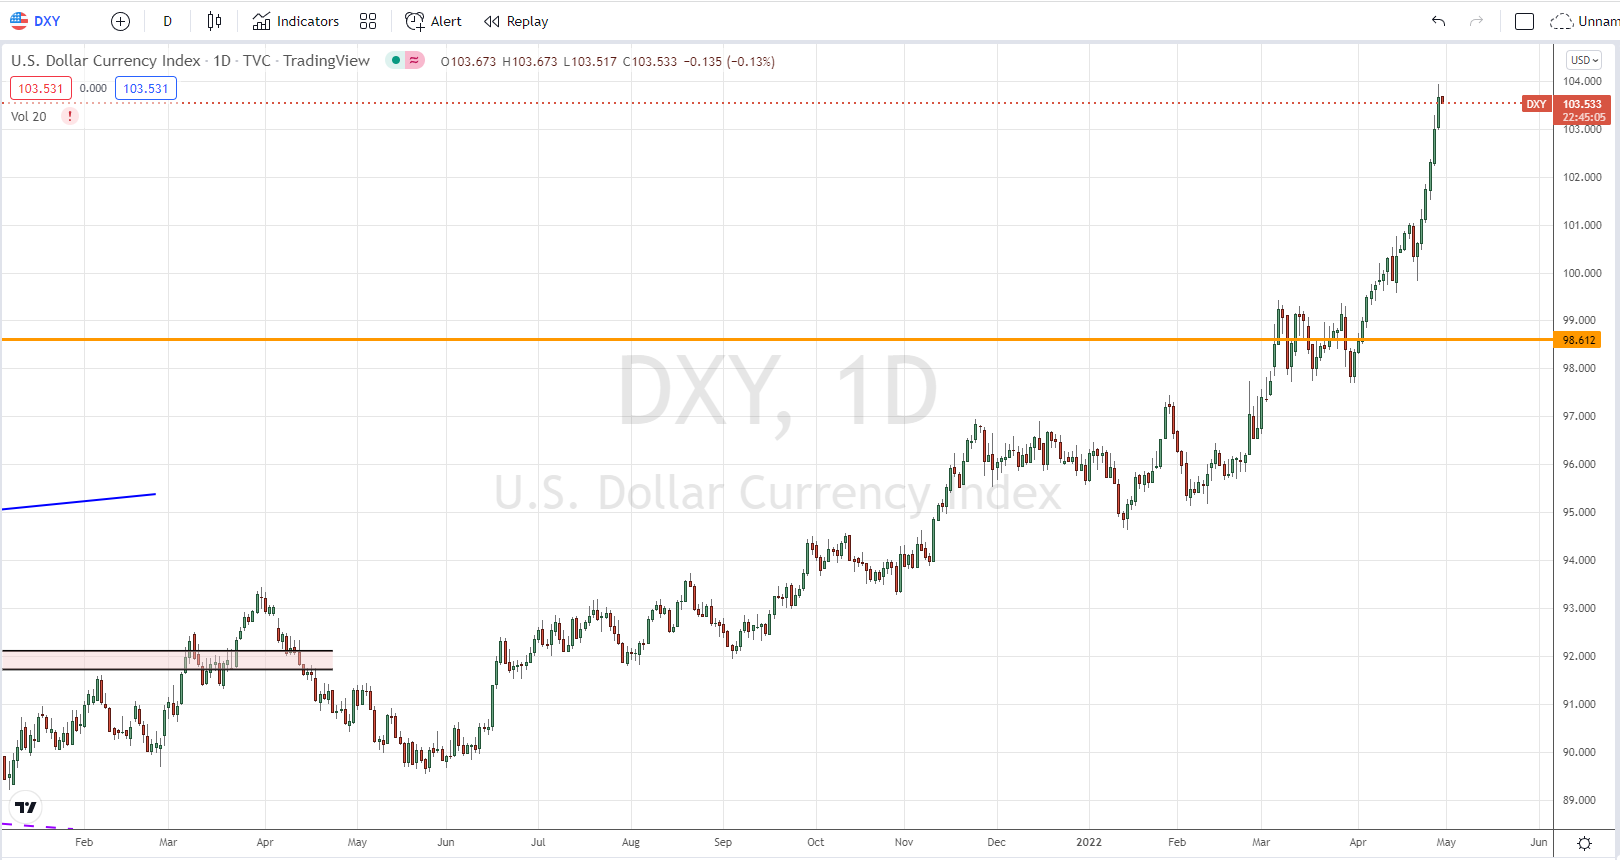
If you look, it looks like the dollar is performing extremely well. It’s gone up over 13% in the past year, yet if you’ve tried to buy anything at all over that same time period you might have noticed that your dollar doesn’t go nearly as far. Why is that?
Well, the DXY measures the dollar against a basket of poorly performing currencies.
The euro is, by far, the largest component of the index, making up 57.6% of the basket. The weights of the rest of the currencies in the index are JPY (13.6%), GBP (11.9%), CAD (9.1%), SEK (4.2%), and CHF (3.6%).
So 70.2% of that basket is the Euro, and the Japanese Yen. Two currencies that are and have been printing money as fast as they can for the past 7 years. The DXY is not helpful at all as a measure of the dollars performance, and is only really indicative of the failure of the Yen and Euro to retain value.
You can safely ignore the DXY moving forward.
6. Crypto Macro
No direct price predictions were provided for Bitcoin at the start of the week, and prices mostly ranged within the two support and resistance zones that were present.
One resistance zone lies at $42,092, and a support zone lies at $39,382. Expect price to range between the two. It might break to the upside or downside, but there is no clear direction that can be predicted here
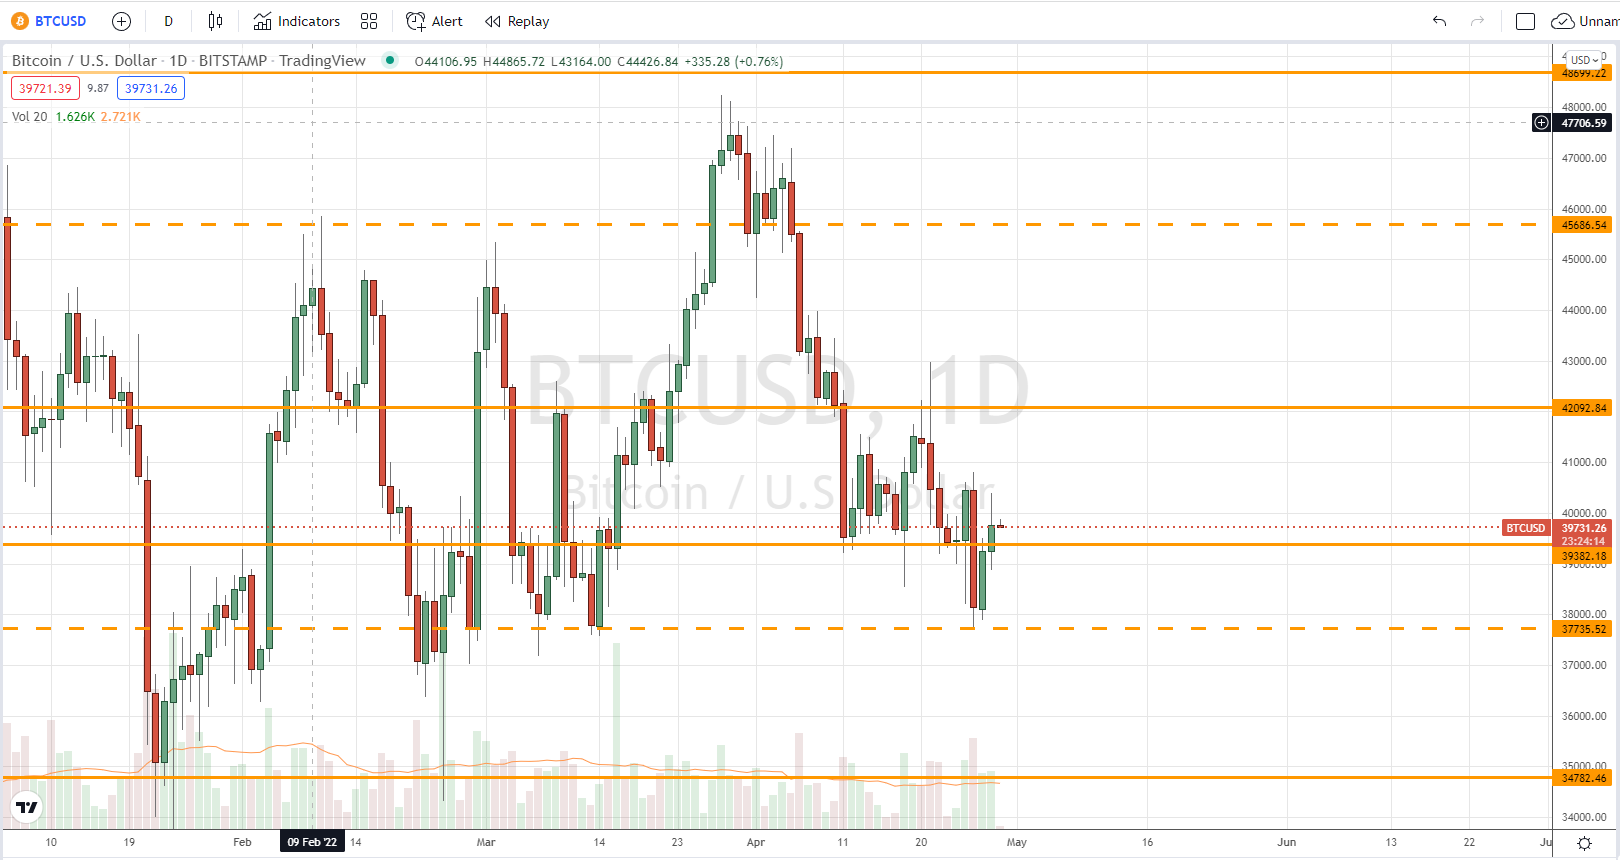
On Monday price dipped below and touched the next support line at $37,735 before returning to the same zone it was previously in. This price action suggests that bitcoin price will break below this zone and we may see it ranging to as low as $34,782 within the next two weeks. This price action is bearish and outlines prices moving down in the future.
As far as counter-indicators go, Cramer is calling for ETH to do 40% to the upside, so we are likely going to see short term moves downwards as he’s so out of touch that you can usually counter-trade him and make money. The truth is that Cramer isn’t out of touch. He’s paid to shill. Essentially a large financial entity has a capital position on ETH they want to exit, but they want to make sure enough exit liquidity is there for them, so they tell Cramer to talk up the opposite position. If you have any leveraged long positions on ETH, I would exit. You want to only have spot exposure here, which of course has been the advice on this substack since it started.

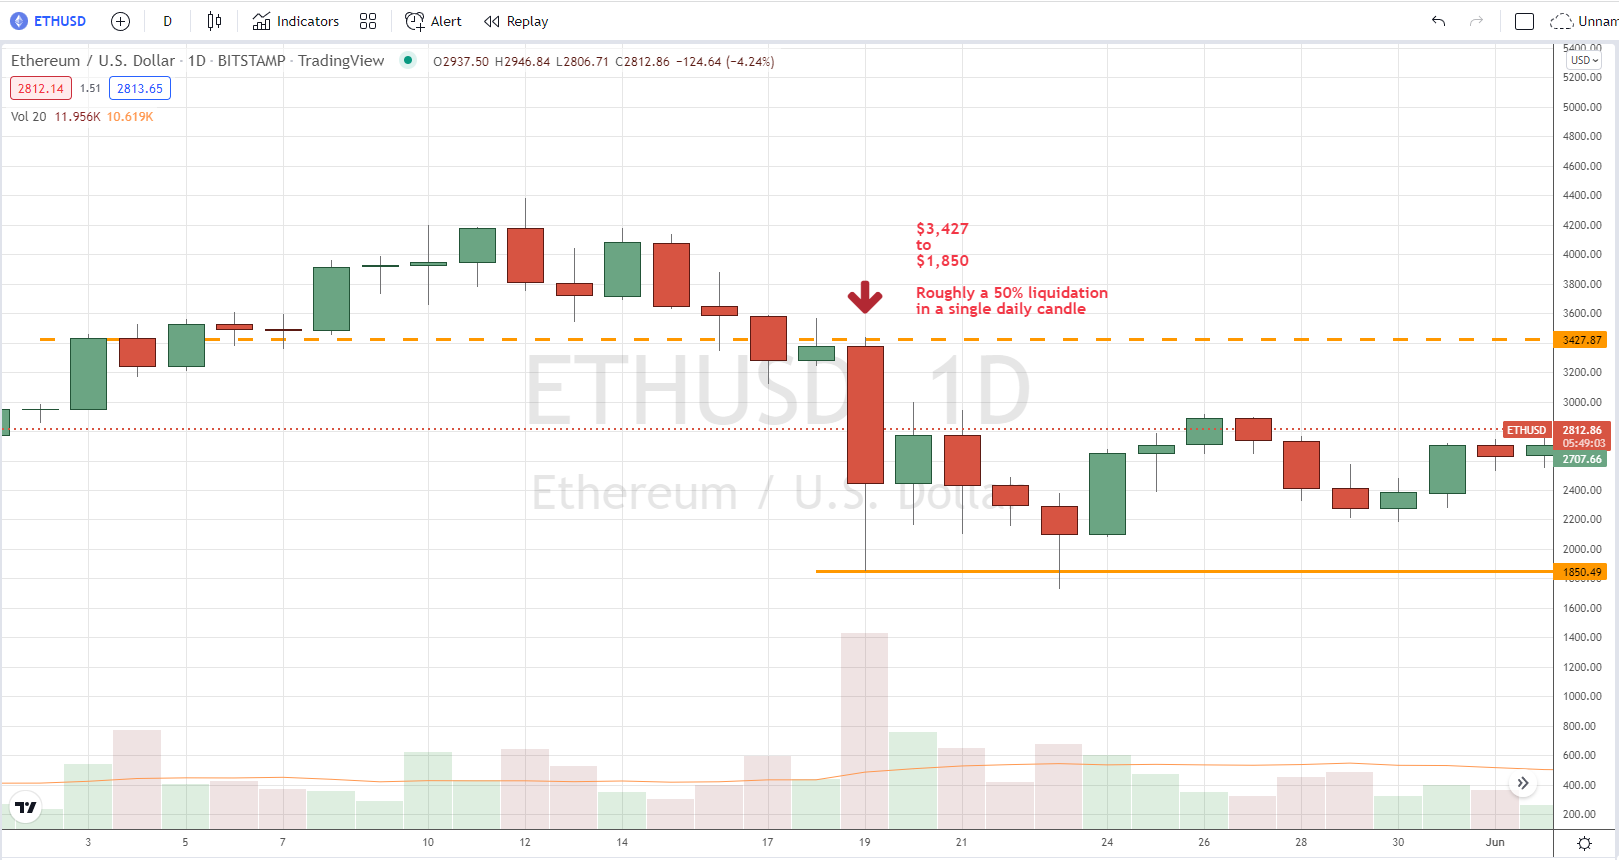
As those of you that have been reading since November are aware. The trend for crypto until the Fed steps in and starts printing again is for prices to be flat or down. Which is why you should not be over-extending yourself. When the bottom is in, it will be fairly obvious because of how much pain people will be in. Think back to March 2020. Bitcoin had fallen from it’s high of ~$20,000 down to $3,700. Ethereum was down from it’s high of ~$1,400 to $88. Any assets that had been around since 2018 were in the absolute doldrums. The speculators were almost entirely chased out of the markets and only the users were left. Think about where we are now. The Fed hasn’t capitulated. The narrative is still about when Quantitative Tightening will start. The markets still haven’t yet realized how alarming the treasury yields are yet. We haven’t gotten to the point where a bottom can come in yet.
What does a bottom look like? The absolute low for the day will likely be 50% down from the high. Why? Every single leveraged position will be liquidated or closed. Which means that even the smallest leveraged position that can be held (1:2), will be liquidated. All leveraged positions will be wiped; and in general, once all leveraged positions are wiped the market loses its ability to cascade down further again for quite a while. Within crypto markets, spot holders are some of the most price insensitive financial entities. Everybody is basically diamond handing the primary assets of BTC and ETH. At any given time, the most a market can liquidate is 50%, and where BTC is concerned, I don’t believe a 50% daily liquidation is even possible anymore. I could still see ETH doing a 50% pinbar to the downside on a daily candle to shake out the liquidations, but I think BTC has too much buying volume on the order books to do that anymore.
The treasury markets will continue to absorb more liquidity as rates continue to be pushed upwards without the Federal Reserve funding the US treasury through money printing. This means prices will continue to grind downwards.
Cosmos ($ATOM)
As we are tracking interoperability projects, there is some news from $ATOM this past week. EVMOS is now live, and for those of you that qualified for the Airdrop mentioned in the last Crypto Macro Post, it will be live to claim by May 3rd. I would expect the EVMOS chain to appreciate and facilitate the expansion of $ATOM quite a bit. For those looking to expand into DeFi, I would expect DeFi options within $ATOM to be at an inflection point now for a significant expansion, and would consider DCA’s into $ATOM at this point and moving forward to be an intelligent move, especially as the amount of Airdrops being announced for $ATOM accelerate into the summer.

Remember the advice for airdrops, especially for projects you know nothing about.
Its free money. There is a basic rule of thumb for managing airdrops. It’s this. Sell half of the airdrop within the first few days of receiving it. You can sit on the rest as a moonbag if you like whats being offered.
The amount of value you can secure in the first few days of an airdrop, is usually not seen again unless you hold the project for a year or two. Don’t think, just sell at least half in the early days. When you’re holding one of these tokens and its the first few days, it will run, 2x, 3x, etc. and you’re instincts will be screaming at you to hold it because its going to run. It’s not. Don’t think, just plan an exit for at least half within the first few days.
This is especially true for projects launching on a chain like $ATOM that is now entering a hype cycle. Sell half of the airdrop, do not buy any of the tokens until a few weeks or months after the launch when the token is down 90%+ from its launch price. Yes, the token price is supposed to go down after launch, this isn’t an indication of a broken protocol, it’s simply an indication of the initial token scarcity upon launch. Someone else wants the tokens more than you do and they’re willing to pay a lot for early access. You received early access for free. Don’t think, just sell a portion of your access and pocket the money.
If you are curious to buy into $ATOM below is a basic price assessment moving forwards.
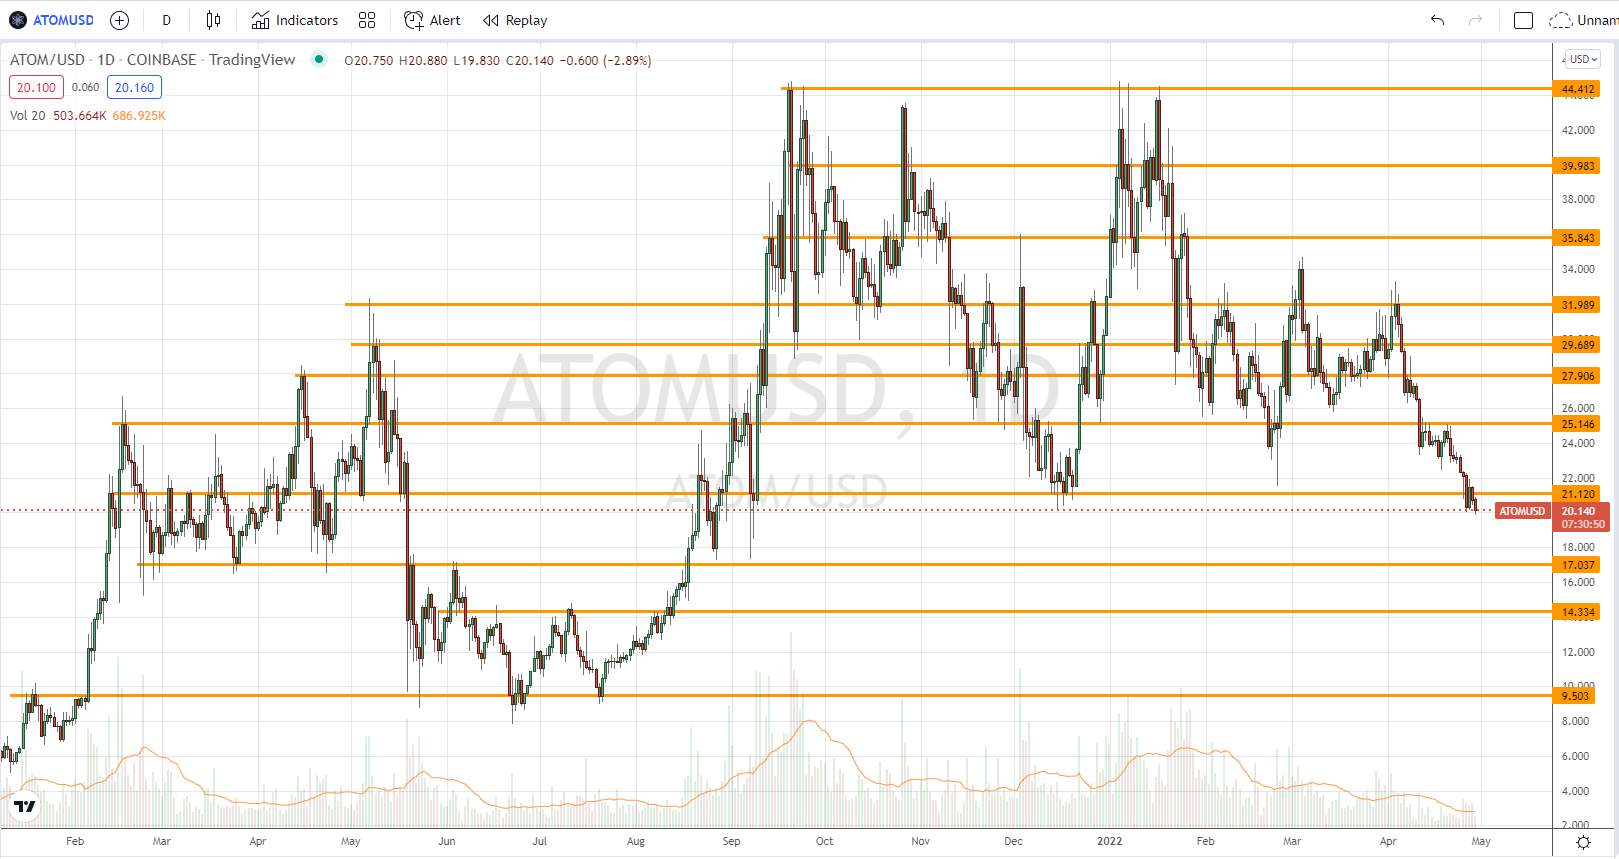
Currently $ATOM is just below a price support zone around $21.12. We can expect it to be pushed down along with the broader markets. Potential good entries for $ATOM are in the teens, with the next support zones presenting themselves around $17.03 and $14.33. Currently $ATOM’s marketcap is around $5.7 billion. If $ATOM’s DeFi options and opportunities continue to accelerate as I suspect they will, it could make a push into the top 10 marketcap, which would present a marketcap around $25 billion or above, and price targets in the $80s or so during the start of the next bull market after the Fed capitulates. It’s also possible that the EVMOS chain itself might find some value, looking at the dApps that have prepared to launch on EVMOS, you can see it’s already quite extensive. There is a decent bit of VC interest in EVMOS, if you participated in this airdrop it’s certainly possible that it could appreciate significantly as liquidity is bridged to EVMOS from ETH by people wishing to use these dApps. I would keep an eye on this launch as it has the potential to be another hype coin.
7. Conclusion
Twitter presents reasons to be hopeful.
The US economy enters stagflation.
Central Banks future’s are starting to solidify. Canada up, Europe and Japan down.
Crypto macro is still flat or down.
The Cosmos ecosystem is growing further, and EVMOS may present the next hype coin for ETH liquidity and dApps to bridge to.
I realize I never touched on European GDP.
Truthfully I stopped looking at European GDP years ago (2017) because it was basically always at 0 or negative. The release this morning was the same. GDP growth of 0.2%, while inflation of 7.5% for Q1. Thats stagflation. The European Union has been in stagflation for at least 5 years with only a few brief periods of growth. This mornings report was a nothingburger to me, but I forget that not everyone else has my perspective on Europe. Just know that growth in the EU is typically negative and that this is normal, and not cause for any additional alarm over the alarm that should already be felt in relation to Europe.
https://www.cnn.com/2022/04/29/economy/europe-economy-gdp-inflation/index.html
If I were Elon I'd just focus on getting the existing companies to perform at their potential. Twitter is an international town square and it had so much potential. They made a decision to selectively eliminate long tail subcultures that didn't fit their worldview. That was a mistake & I'd like to see that fixed before moving on to other acquisitions.
The other thought is I'd like to see him buy or develop a nuclear power company as a power source for all this electricity that's currently generated with fossil fuels. I still think that's a better bet than renwables.