


July US Treasury Auctions
Tracking QT

I have now segregated US treasury bond auction updates into their own separate post. This is the 6th of a monthly series of posts updating the bond auction rates and bid to cover ratios. I have previously covered these within the weekly updates. I consider this to be the most important part of what I am covering on the substack and it is where we will see the first signs of distress within the market that the federal reserve cares about the most.
You can view the previous Months’ posts below
(Prior to February Treasury auctions were tracked in the weekly forecasts)
Please refer to the Backdrop Post and trade with mindfulness.
Please refer to Definitions page for any terms or abbreviations that I use that you don’t understand. If a term is missing, please let me know.
Since this is a repetitive series, the text that is repeated each month is in quote format.
Edits were made to Section 1 on 7/21 - thanks to a comment from K that provided a more nuanced view of the Federal Reserve’s actions. These edits can be identified by my use of the strikethrough text to show what parts of the original post were changed.
Table of Contents
State of the Narrative
Primary Auction Results July
Bid to Cover Ratios
Interest Rates
Secondary market Treasury rates
Market Impacts & Conclusion
1. State of the Narrative
As usual we will start out with a State of the Narrative, this one will be shorter than the initial segment in February as we simply have to cover the changes over the last month.
Quantitative Tightening has begun, As noted a few weeks ago, QT became evident on the Fed’s balance sheet starting on June 22nd, which ironically is exactly when last months treasury auction post came out. Looking at their balance sheet tracker we can now see the clear trend of the total assets held beginning to decrease.

Now that Quantitative tightening is under way I will do my best to keep track of their progress in a repetitive way that can be followed along fairly easily. Of note, Quantitative Tightening will start with $47.5b of assets being sold into the secondary markets every month (These assets are not being sold, they are being allowed to mature and the proceeds are not being reinvested into the secondary treasury market, thanks to K for the comment). $30b of which will be treasuries, and $17.5b of which will be Mortgage Backed Securities. Within 4 months (September/October) this will ramp up to $95b a month. $60b of which will be treasuries, and $35b of which will be mortgage backed securities.
The results of these sales into (this lack of buying in) the secondary markets will be significant increases to the interest rates available in the mortgage markets and treasury yields will continue to spike as the price/value of treasuries and bonds continue to fall. I am not able to track precise movements in the Feds balance sheet to see if they are meeting their monthly targets, and will mostly be looking in retrospect to see how much the balance sheet decreased in a peak-to-peak fashion. We’ll be doing this with Two charts roughly tracking from the middle of each month with the format below. Please chime in if you think any changes should be made to the format for quality of life.
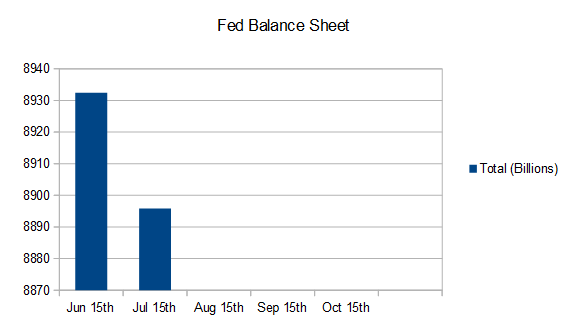

As we can see, from June 15th to July 15th, the Fed’s balance sheet shrank by roughly $36.5 billion dollars. This is, of course, several months late as they originally promised they would start this process in February 2022, but you’ll see why they delayed it this long in a couple of months. The end results of this action will be felt across two sectors. For home-buyers, this will mean future mortgage rates will continue to go up as mortgage debt will be harder to repackage and offload if your bank wants to be carrying less risk because they now have to compete with the MBS’s that the Fed owns and will be selling into (there will be less purchasing of MBS’s in) the markets every month. They will have to ask for higher borrowing rates from prospective home buyers because the markets will have far less appetite to buy claims to those mortgages because they are currently being force-fed by the Federal Reserve already.
The other major impact being felt by this will be directly in the treasury markets themselves. If the Fed joins in as a party selling into (As the Fed decreases treasury purchases further in) this market it will cause significant distress. What we saw last month was likely from the start of QT. At the time I couldn’t be certain but I could at least warn you that the market was being stretched in a way it didn’t like.
From what we saw in the secondary treasury markets in the week of 6/6/2022-6/10/2022 I suspect that QT has started, and it’s the main reason I stated that the following week would be one of the bloodiest weeks for the markets in recent memory.
The treasuries markets closed on Friday with treasury sale values in freefall and rates skyrocketing. That trend will continue into Monday, and I expect Monday 6/13 to be one of the worst days for the markets as a whole in recent memory.
I would bet that the selling (Jump in yields) on Friday June 10th was either the Federal Reserve, or was from privileged parties that knew ahead of time what was going to be the beginning of QT the following week.
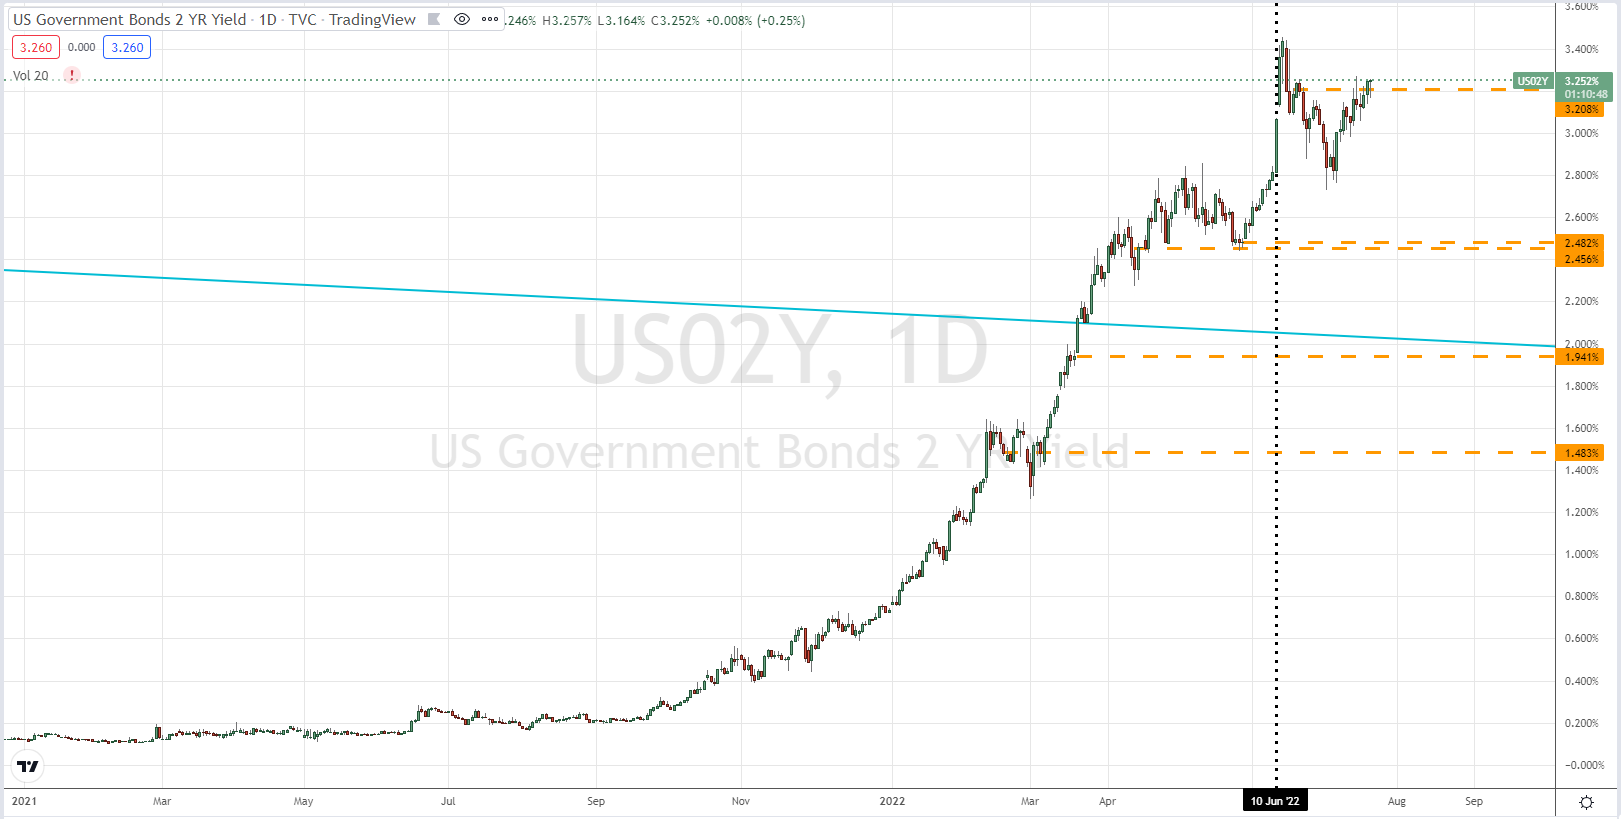
That is likely what that big vertical line was on last months chart of the 2 year Treasury yield was. I’ve highlighted on this months chart with a vertical dotted line below.
For continuity sake, below is the same chart of the yield from the 2 year US treasury note that I have provided in every single one of these treasury bond posts. Each post has been accompanied by an orange dashed line to better help you to visualize how much yields have grown over the course of a month.
It’s no coincidence that the following Monday was in fact one of the bloodiest days for the markets across the board, and that basically everyone who was over-leveraged in crypto started getting wiped that week. As the Federal Reserve ramps up into QT it will hit the US stock markets the hardest. If you pay for this substack, you already know my macro outlook for crypto in the short term, and I’ll include that in the conclusion on the other side of the paywall on this post. For the rest of this year, or for as long as the Federal Reserve can withstand the fire, the stock market will grossly underperform expectations. The bond markets will continue to be in free-fall and anyone wanting to exit their treasuries early will be taking a nasty haircut, and inflation will not abate. This will all be going on while companies, especially white collar, will be laying off staff. We saw who was over-leveraged in crypto, we are now about to see who is over-leveraged in their life-style and does not have the savings or diversified income to be able to weather the storm if they are cut.
Those jobs will be replaced by South Americans, Africans, and Asians with laptops. To cut costs during the recession that will officially be said to have started on June 31st, 2022; most companies will turn towards their bloated white collar workforce. The lessons learned from remote work is that there is no reason to hire an American for a 100% remote position. And after the layoffs, this part of the labor force, when it is rehired will likely be 80% foreign.
The amount of pressure that the administration will be putting on the US Federal Reserve to “do something before the mid-term elections,” will be herculean. I doubt that the current administration even knows what the problem is or what needs to be done, but that won’t matter, the pressure will be applied regardless. We just have to see when they will collapse underneath it. I have no doubt that they will, and now that we’ve made it through most of the fire (on the crypto side) it will be a lot easier for us to hold our positions in crypto moving forwards while it will be a lot harder for those in Traditional Financial Instruments.
Now, lets jump past the paywall and see how the Fed performed in the latest auctions.
Keep reading with a 7-day free trial
Subscribe to Flirtcheap’s Asymmetric Economics to keep reading this post and get 7 days of free access to the full post archives.