

August US Treasury Auctions
August US Treasury Auctions
Extended Yield Curve Inversion

I have now segregated US treasury bond auction updates into their own separate post. This is the 7th of a monthly series of posts updating the bond auction rates and bid to cover ratios. I have previously covered these within the weekly updates. I consider this to be the most important part of what I am covering on the substack and it is where we will see the first signs of distress within the market that the federal reserve cares about the most.
You can view the previous Months’ posts below
(Prior to February Treasury auctions were tracked in the weekly forecasts)
Please refer to the Backdrop Post and trade with mindfulness.
Please refer to Definitions page for any terms or abbreviations that I use that you don’t understand. If a term is missing, please let me know.
Since this is a repetitive series, the text that is repeated each month is in quote format.
Table of Contents
State of the Narrative
QT Tracker
Primary Auction Results August
Bid to Cover Ratios
Interest Rates
Secondary market Treasury rates
Market Impacts & Conclusion
1. State of the Narrative
As usual we will start out with a State of the Narrative, this one will be shorter than the initial segment in February as we simply have to cover the changes over the last month.
Quantitative Tightening has begun, As noted last month, QT became evident on the Fed’s balance sheet starting on June 22nd, which ironically is exactly when June’s treasury auction post came out. Looking at their balance sheet tracker we can now see the clear trend of the total assets held continuing to decrease.
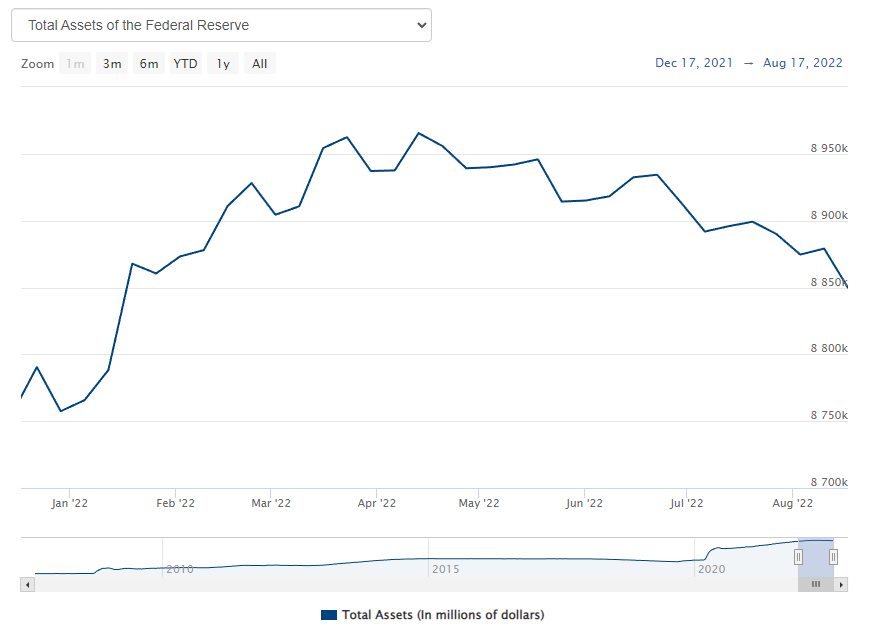
Now that Quantitative tightening is under way I will do my best to keep track of their progress in a repetitive way that can be followed along fairly easily. Of note, Quantitative Tightening will start with $47.5b of assets allowed to mature and the proceeds not being reinvested into the secondary treasury market. $30b of which will be treasuries, and $17.5b of which will be Mortgage Backed Securities. Within by next month (September/October) this will ramp up to $95b a month. $60b of which will be treasuries, and $35b of which will be mortgage backed securities.
The result of the Fed allowing their balance sheet to taper off in this way will be interest rates continuing to rise until the Fed gives in and returns to money printing. There are many people who think that when the Fed stops raising the overnight lending rate that interest rates will stop rising. But this is simply not true. The only thing impacting how fast interest rates rise is how much debt is being sold and how many people are willing to buy this debt. The Fed is withdrawing what was previously a significant source of demand in these debt markets. Even if they stop raising the overnight lending rates, this has no impact on how much demand is present at the treasury auctions, and if less demand is present while the amount of debt we need to sell continues to increase, there is no other outcome. The rates will rise.
As has been repeated at least once a week here, there will come a point when interest rates on US treasuries are reaching the danger zone (maybe 4-6% on the 2 year note), and the Fed will cut the rate they are currently offering on the Overnight Reverse Repo Facility (Overnight RRP) down to 0%. There is currently ~$2 trillion in this facility. If the Fed stops paying interest to people who borrow treasuries from the Fed in the RRP, this liquidity will likely flow into the general financial markets and some of it will go to the US Treasury markets and will tamp down interest rates for a short while. After that, the Fed will have no other tools but to return to QE if they want to try and impact the market.
I’m curious when Janet Yellen will begin to speak about the risk to the treasury on the shorter end of the yield curve (4 week debt, 3 month debt, 6 month debt, and 1 year debt). By the end of the year these notes which represent about 25% of total outstanding debt will have gone from essentially 0% interest to maybe ~3.5-4%. That’s a pretty large delta in interest payments from January 2022 to January 2023. On $8 trillion, this represents a change from maybe $8 billion in interest to $320 billion in interest on this tranche of debt alone. For reference, interest on this tranche of debt alone would represent 80% of total interest on the national debt in 2015.

But what happens when at that exact same time we have a massive decrease in tax income as no one has made any money at the capital gains level, nor at the corporate level as everyone is struggling with inflation, supply chain, and fed tightening? The Treasury will be having to sell significantly more treasuries than they expect to, and they’ll be doing it into a market that already has stressed levels of interest due to a lack of buyers.
Just from having a mild understanding of when roughly 3/4th of Capital Gains income is paid (April, lol you know this too), we can already presume a rough time frame for when pressure is likely to ratchet up even further against the Fed. I know I really shouldn’t be giving dates for people to be thinking about, as the purpose of this substack is to actively monitor the markets in real time and react as things break down, but just from how things are shaping up, I would expect march/april 2023 to present a point in time to be watching for emergent treasury instability beyond the instability that will already be occurring. Instability is by definition always going to present a buying opportunity. Don’t get blindsided, and don’t key in on just this date. From now to spring 2023, we have a lot of other market events to watch and to trade.
Now lets look at the 2 year US treasury note:
I would bet that the jump in yields on Friday June 10th was either the Federal Reserve, or was from privileged parties that knew ahead of time what was going to be the beginning of QT the following week.
That is likely what that big vertical line was on June’s chart of the 2 year Treasury yield was. I’ve highlighted on the chart with a vertical dotted line below.
For continuity sake, below is the same chart of the yield from the 2 year US treasury note that I have provided in every single one of these treasury bond posts. Each post has been accompanied by an orange dashed line to better help you to visualize how much yields have grown over the course of a month.
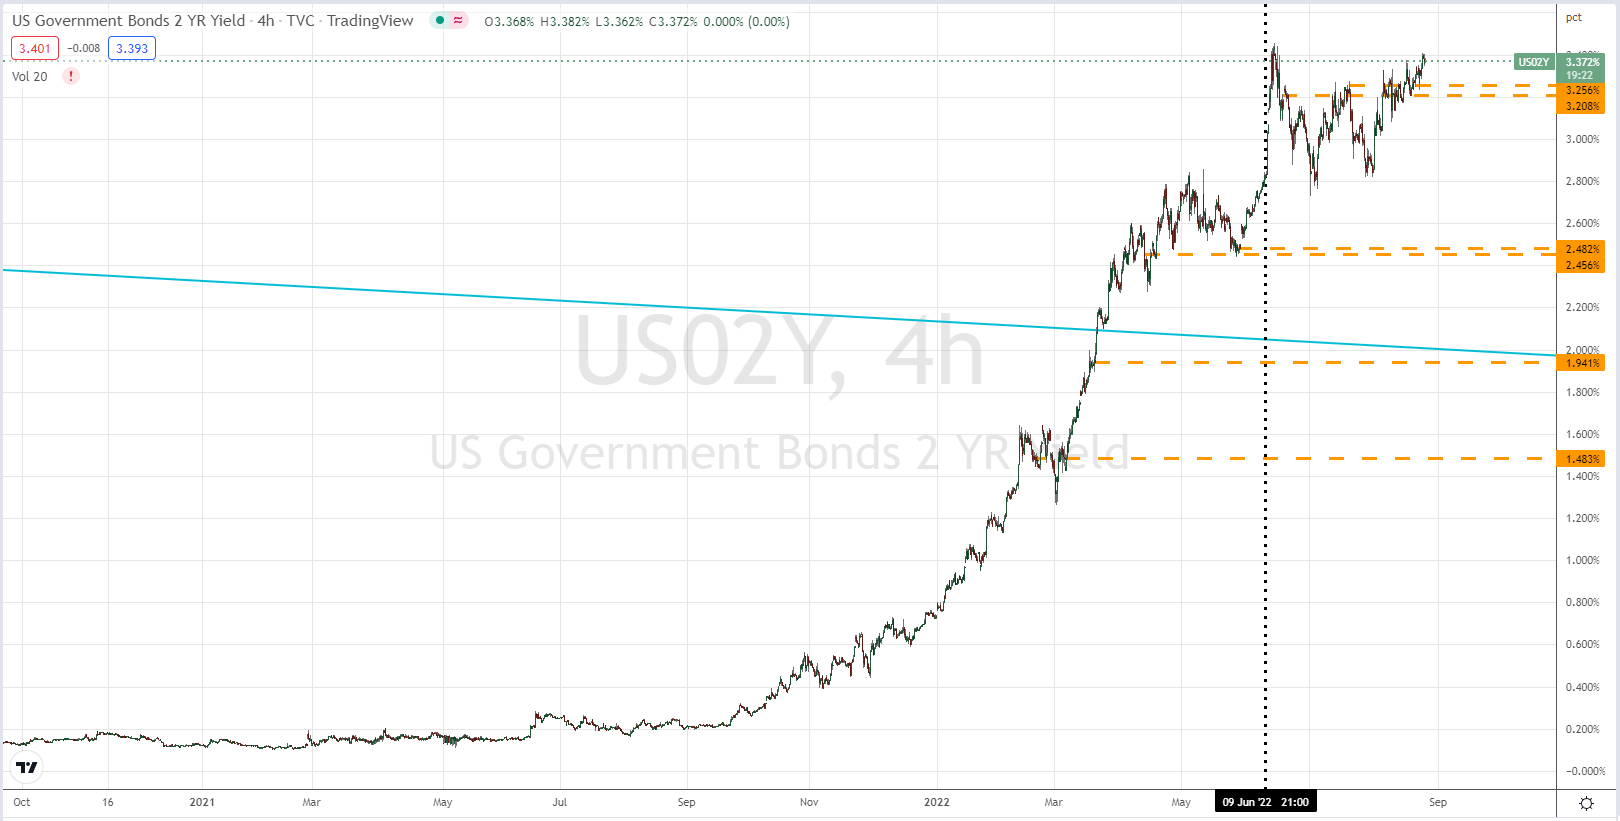
Looking at the above chart, I would expect that by this time next month, yields will be at new highs above the peaks in June, and we will be seeing a continuation of the trend that has dominated this year. Stocks, Equities, and assets grinding downwards, or flat. Every asset that is intrinsically tied to the US market has it’s price determined by the price of money at that given time. The price of money is determined at the US primary treasury auctions every month. The value of half of every financial transaction you ever engage in is determined right here. You should understand how government demand for money, and investor willingness to lend to the Federal Government is the single largest driver of the price of everything that you want or need. As rates push higher for the rest of the year, you’ll see this stress reflected in the asset markets and financial markets. Meanwhile, inflation will not end.
Keep reading with a 7-day free trial
Subscribe to Flirtcheap’s Asymmetric Economics to keep reading this post and get 7 days of free access to the full post archives.